
How Investors Can Navigate the Ocean of Factors
Understand your factor betas, your proficiency in comparison to factors, and the significance of factors in your portfolio.

In a prior piece, we talked about how capital allocators can use fundamental factors to better understand portfolio risk. We think that approach is enhanced through careful exposure and position-level aggregation. Fund managers have different issues to deal with. Most notably, the interpretation of what their factor models tell them about their portfolio management. Today, there are endless combinations of factor models. Some are sold by leading risk analytics firms, while others crop up in academic journals. Fund managers are finding themselves swimming to keep up with the newest factor models, as well as the implications each may have on risk in their portfolios.
The waters can be choppy, and the insights less than obvious. Just because you can calculate a regression across a combination of factors does not mean you’ve found meaningful results. Our computational power has exceeded our patience to think about first principles (i.e., the foundation of a hypothesis). First principles must be step one in any type of regression analysis. This is even more important for fundamental investors who view factors as by-products of their investment processes, rather than the principal strategy.
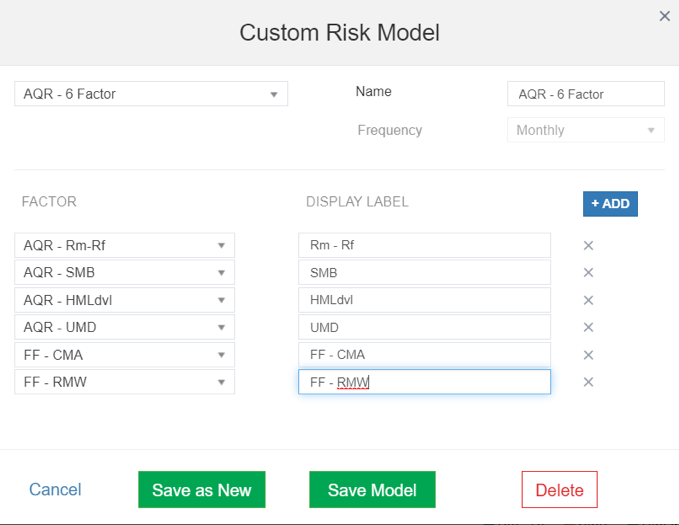
As an example, let’s take two recent similar factor models that are popular in domestic equities. The first is Fama and French’s 2015 5-factor model. These esteemed researchers are titans in the field, with Gene Fama a Nobel laureate for his work in the space. The second model is AQR Capital Management’s Six Factor Model. This firm is a titan of quantitative investment with ties to this strain of academic thinking. However, their differing perspectives push them toward different models. One is the culmination of theoretical underpinnings of market efficiency. The other is a practioner’s view on much the same.
We choose these two because the supporting data behind these models is publicly available on their respective websites (Ken French Library | AQR’s Data Repository). Additionally, the factor formulation is rooted in the same philosophical approach to thinking about cross-sectional security returns. The main difference between the two factor models? Oversimplifying for brevity, AQR modifies the classic definition of value, while also adding price momentum (UMD) as a 6th factor. The AQR piece linked above does a good job of summarizing the differences, but anyone outside of academics must be left scratching their head saying, “so what?”
At Novus, we believe in building flexible tooling that allows investors to be empowered by their data rather than confused by its complexity. Any user of Novus can simply upload a return stream representing a factor (investable or not) and use it in our regression framework to understand their factor betas, their proficiency in comparison to those factors, and the significance of those factors in their portfolio. Like most portfolio analytics, no one aspect of exposure, risk, or performance tells the story. Rather, a combination of all reveals the truth.
Let’s look at a mock long-only portfolio and see what we can elicit about its factor exposures by analyzing it across these two models. A few basics about the dataset: this is a domestic equity long portfolio, so both of these factor models are applicable. The position-level data is daily, but we will review it in monthly time series. We choose a portfolio of mid and large cap US equities as an illustrative example. This portfolio can be thought of as benchmarked to the S&P 500.
Fama French Model
Starting with our Fama French Model, first we can look at our point in time factor betas, our adjusted r^2 to get a sense of model fit, and some statistics regarding regression and residual volatility. While this is a good encapsulation of current portfolio risk, it is a bit academic in presentation:

What’s more powerful is how the Novus platform unpacks a time-series of factor betas across the portfolio. It does so not on the return stream of the portfolio, but on the portfolio constituents at each point in time. The following chart demonstrates these factor betas over time (dating back to 2015), allowing us to understand trend and change:
We can also analyze the excess performance the portfolio has generated in comparison to a tracking portfolio which strips out the factor betas analyzed through the model. While the S&P 500 may be the policy benchmark of the portfolio, this chart provides a different understanding of the risks the portfolio took versus our Fama French factor model, and the premium generated (or lost) as a result:
As we can see, per the model, the portfolio has underperformed its synthetic betas by 130bps per year.
AQR Model
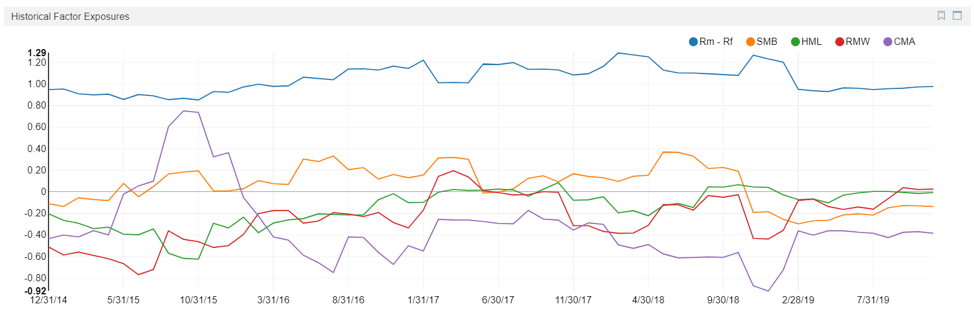
Same portfolio, similar factors, but different results. The AQR model has a difference calculation methodology for HML, while also including the popular momentum (UMD) factor. A few things jump out when reviewing the panel.

First, notice the impact on HML. This factor is slightly different, and while the beta remains fairly neutral, the direction changes. This may be due to the change in that single factor, or the addition of UMD, which can covary with the other factors. Next, notice the impact on RMW and CMA. More evidence of how a model’s fit can change some of the output.
We see the impact of these changes most visibly in the tracking comparison. The tracking return dips about 12bps per annum from 10.47% to 10.37%, with slightly lower volatility.
So What?
It may feel like we are splitting hairs, but when evaluating the performance of a manager, these distinctions are important. If momentum is integral in one’s thinking, it should be incorporated into the unpacking of risk. If not, it should be observed to understand the effects of meaningful market participants in driving security pricing.
Passive investing and its smart beta brethren continue to absorb capital flow, and that flow will increasingly impact security-level returns. One size (more than often) does not fit all, and investors need to be careful in their choice of factor models, just as they take care to select benchmarks for important decisions such as performance evaluation and compensation.
Perhaps most importantly, a model isn’t a panacea to one’s woes, nor an excuse for relative performance. If you’re a value investor facing a consistent headwind in the value factor’s underperformance, it is not enough to simply point at it and explain away one’s returns. We need to stop playing the factor blame game. Instead, let's think about how technology can lead us to adapt our process for more sustainable results. Ultimately, this is how businesses adapt, and stockpicking will not be immune to this trend. At Novus, we’ll be here to provide the tooling investors need to make intelligent choices in an ever-changing world.