
The Skill of Prediction: Hedge Fund Position Sizing
Position sizing can often seem like luck, but some managers have proved their skill time and again. In this post, we'll investigate how.

For portfolio managers, sizing positions is a bit like trying to predict the future. Picking stocks is challenging enough, but after your lineup is set, how do you allocate amongst all your ideas? Which investments in the portfolio will outperform the others? Certainly, there are many factors that go into sizing decisions, and these go beyond the traditional research that got the investment into the portfolio in the first place. Considerations like correlation, liquidity, expected volatility, diversification benefit, concentration, and risk all play a role in the portfolio manager’s sizing decision.
For our purposes, let’s simplify matters. We can think of each sizing decision as a binary prediction. If a position is weighted above the average portfolio holding, it means that the manager is expecting a higher than average return on invested capital (ROIC). In such a portfolio, the difference between the returns of an equally weighted portfolio and the actual weighted return we ascribe to position sizing alpha. It’s the net result of all sizing decisions. This can be critical to a manager’s success.
(Alpha usually refers to the intercept of a regression against a benchmark. In this case, alpha is calculated as active premium, the absolute difference between the investment’s return and the benchmark. The benchmark used is the return of an equally-weighted version of the investment.)
Many elite managers owe most of their winnings to their ability to consistently generate value through sizing decisions. In other words, they consistently make accurate sizing decisions. To that end, position sizing alpha is a good measure to evaluate the sizing decisions made by a manager and assess their skill at optimizing a portfolio – at least with regards to relative performance of their own positions.
This three-part study uses public ownership data via 13Fs and other regulatory filings simulates performance of 1,178 managers, spanning over 10,000+ unique securities per year. The data spans six years covering January 2010 through December 2015. All data we used in this study is sourced exclusively from the public domain with all other limitations inherent in regulatory disclosure data. Nevertheless, position sizing skill lends itself well to analysis through public data. Managers are required to file market values associated with each position, revealing relative position sizes. Thus, position sizing alpha can be calculated, tracked and analyzed across managers in an apples-to-apples comparison.
Part I is a review of our findings from analysis of our manager universe with regards to the metric. Part II will unpack how the skill is compromised by sharp asset growth and will also answer some questions posed in the first section. Finally, in part III, we will propose a robust way to analyze an individual manager’s ability to successfully add value through sizing. We will also study a few examples of managers with a history of success in sizing.
Findings:
1. The average hedge fund manager outperformed an equal-weighted version of themselves.
Managers, on average, make money on sizing decisions – the average annual outperformance over an equal weighted portfolio was 0.38% for all managers. This means that an equally weighted portfolio would have generated 38 basis points LESS per year for the average manager. The average was skewed by a few positive outliers belonging to very concentrated portfolios, while the median manager fared a bit worse at positive 33 bps per annum.
2. More than half of managers make money through position sizing.
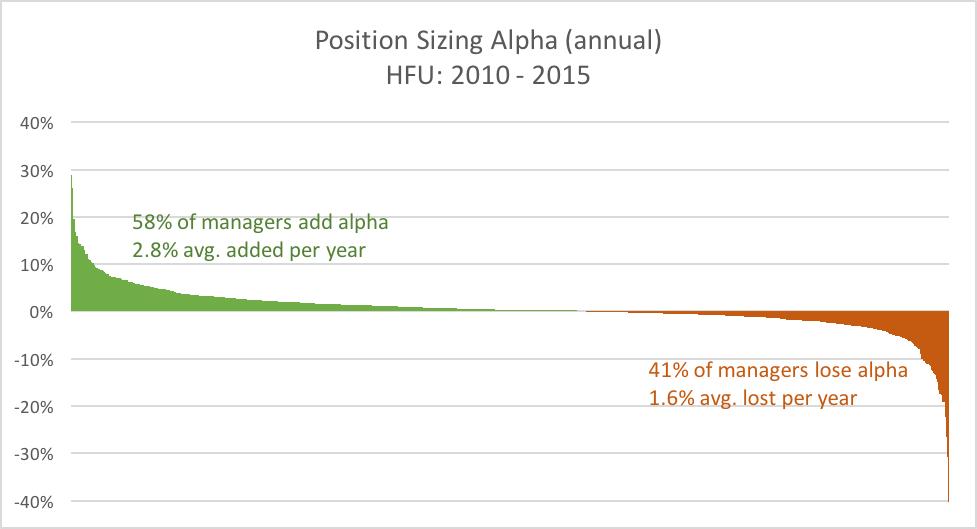
We found that more than half of the managers in our universe benefit from position sizing in absolute return terms. Since January 2010 through the end of last year, 57.5% of our HFU managers outperformed equally-weighted versions of themselves, and 41% underperformed. The remainder saw no difference in annualized return due to sizing.
3. Spread between good and bad position sizers is wide.
The standard deviation for position sizing alpha of all managers over the last six years was 4.9%. It’s important to note that for those that do make money, sizing decisions add an average of 2.77% a year. The spread between managers who add value and lose value was 4.33% per year. Managers that underperform equal weigh versions lost an average of 1.56% per year to their equally weighted versions. That is a lot to give up from your well-researched book of investments.
4. Historically, managers had mixed results in sizing.
Managers added value in four of the six years we analyzed. Counterintuitively, 2011 was a good year for position sizing while 2010 was not. Most investors remember 2011 as a particularly tough year for hedge funds, but our data shows that it would have been even worse if not for sizing decisions of PM’s and risk managers. Actual performance for the average hedge fund portfolio modeled from public holdings was -4.2% in 2011; equally weighted that would have been -5.8%. This brings to mind the thesis that managers size positions with risk and correlations in mind.

Thus far we have tested if higher positions mean higher ROIC assuming that managers predict higher returns by sizing up bets. We have shown that the average manager makes money on their prediction of ROIC distributions within their book. But maybe another question deserves some research.
Perhaps the higher expected volatility positions are sized down by risk managers to limit the overall portfolio volatility and draw down. This is something will test next by measuring risk statistics such as volatility, Sharpe and max drawdowns for equally weighted portfolios against actual weighted ones.
The Liquidity Deception
How hedge fund liquidity has plummeted under the industry’s most watchful eyes.
Today, few investors realize that, by some measures, liquidity in the equity markets is below pre-Lehman default levels. For active managers, the moderate decline in trading volumes at the exchanges masks an even greater concern. Liquidity, for active managers in particular, has receded to record lows, and is set to decline even further. The problem is that traditional liquidity measures don’t take the herding behavior of active managers into account.
Crowdedness and crowd selling is now a real risk to investors, and liquidity, or lack of such, is a primary ingredient in this risk factor. This study unpacks trends in liquidity that every money manager should understand—ignoring them could be a costly mistake.
Download our latest report to learn more.
